
WHAT IS ASSEMBLERS
Assembler is the Program that supports an environment for translating assembly language programs to Machine executable files, that is, an assembly program containing statements like MOV AL, 10h and directives like MODEL SMALL, which are meaningless to the microprocessor and so are converted to an equivalent machine program. Thus, the assembler program is a translator that does almost a similar type of work as a compiler. But, how is a compiler different than an assembler? One of the major differences to note here is that each high level statement of a C program on compilation will produce many machine statements; whereas an assembly instruction is generally translated to single instruction. We would like to reiterate here that assembly and machine languages is machine dependent and programs written in assembly for one microprocessor may not run on other microprocessors.
An assembler, generally, converts an assembly program to an executable file. There are two standard forms of executable files on DOS. These are: .com files and .exe files. These files basically differ in format as per the segments of the 8086 Microprocessor. (Please refer to Unit 1 of Block 4 of MCS – 012). The steps of the assembly process are:
Step
|
Result
| |
Assemble the source program using
|
!
|
Creates an object file with extension .obj.
|
an assembler
|
!
|
Creates an optional listing file (.lst) and a
|
file for cross reference
| ||
Link the Object file or files
|
!
|
Creates an executable (.exe) file
|
!
|
Creates optional map file (.map) and library
| |
file (.lib)
| ||
Convert the executable files to com
|
!
|
This is an optional step
|
file which are fast
| ||
There are many assemblers that support the above tasks in different ways; even the options available with them are quite different. Let us discuss the basic options available with the commonly used assemblers/interfaces for running assembly programs. You may use any of the following depending on the availability of tools at your center.
Turbo Assembler (TASM)
Assembling
Turbo Assembler allows a user to assemble multiple files. Each file may be assigned its own options in a single command line. TASM allows you to use * and ? wild cards, as they exist in DOS. For example, to assemble all the programs having file names like progam1.asm, program2.asm, program3.asm, you may just give the command:
TASM program? (.asm extension is the default extension).
The turbo assembler allows you to assemble programs in groups. Each group is separated by a + sign. Two of the most common options for turbo assembler are:
/L
|
Generates the list file (.lst)
| ||
/Z
|
displays source line having errors.
|
A common use of command line may be: TASM /Z program1
Newer and advanced versions of these assemblers are also available.
Cross-Reference Files : On assembling a program, a cross-reference file of the programs labels, symbols, and variables can be created with an extension of .xrf. You can use TCREF command to convert this listing to a sorted cross-reference file. For more details please refer to Turbo Assembler help.
Linking : The command line for linking a TASM program is:
TLINK object_filename, executable_filename [,map_filename] [,library_filename] The default extension for object filename is .obj
! The executable file is created with extension .exe file.
! Map file have a .map extension. The map file is used to indicate the relative location, size of each segment and any errors that the linker has found. The map file can also be displayed on screen. You need to enter con (for console), for such display.
! Library file is used for specifying library option.
Converting Object Files to .COM Programs : TLINK command allows you to convert an object program directly to .COM format:
TLINK /T object_filename, com_filename, con
Debugging Options : You can use Turbo Debugger by using the /ZI command line
option on the assembler.
MASM
There are many versions available with the Microsoft MASM. Let us discuss the two latest versions of it.
MASM 6.1
This is one of the versions of Assemblers. It accepts commands of the older versions also. The command that can be used for assembling the program is ML command. This command has the following format:
ML [options] filenames_containing.asm [ [options] filenames.asm] [/link options]
Please note that in the above command the terms enclosed within [ ] are optional.
The options start with a / and some common options are:
/AT To directly convert the assembled file to .com program
/c Assemble the file but do not link it (separate assembly)
/Fl Generate a listing (.lst) file
/Zd Include line number in debugging information
Some simple examples of usage of ML command may be:
ML /c firstprogram.asm
This command will only assemble the file.
ML /AT/Zd first.asm second.asm
This program will create .com file after assembling and linking the two files.
MASM 5.1
This is an old version of Microsoft assembler. It requires separate steps for assembling, linking, and converting into .com file. The command line format for this assembler is: MASM [options] source.asm [,objectfilename.obj] [,listfilename.lst] [,crossreffilename]
You need not specify the .asm extension in the above format, as it is taken by default, similarly, you need not assign .obj and .lst extensions which are assigned by default. Each file may have its own path and filename, which may be different from the source file path.
The following command creates object and cross-reference files with the same name with the suitable extension.
MASM filename,,,
The options relating to MASM are:
/L To create a listing (.lst) file
/Z To display source lines having errors on the screen
/ZI Include line-number and symbolic information in the object file
For getting further explanation on these options using the help of MASM, please type: MASM /H.
Cross-Reference Files : On assembling a program, a cross-reference file of the programs labels, symbols, and variables can be created with an extension of .crf. For more details please refer to Macro Assembler help.
Linking : The command line for linking a MASM 5.1 program is:
LINK object_filename, executable_filename [,map_filename] [,library_filename]
Most of the option and file names as above are the same as that of TASM.
You can also link more than one object files to one executable file by using the command like:
LINK prosgram1 + program2 + program3
Converting MASM 5.1 Object Files to .COM Programs. The EXE2BIN program available in DOS converts .EXE modules generated by MASM into .COM modules.
Assembler Tables
The important tables of assemblers that are available in the .lst listings are:
Segments and Groups Table: The following details are contained in this table.
Name
|
Length
|
Alignment
|
Combine
|
Segment Class
| |
types
| |||||
Provides the
|
Provides the
|
Provides
|
the
|
Lists the
|
Lists the
|
names of all the
|
size, in hex, of
|
alignment type,
|
defined
|
segment names,
| |
segments and
|
each segment
|
such as BYTE,
|
combine type,
|
as coded in the
| |
groups in
|
WORD,
|
or
|
such as
|
SEGMENT
| |
alphabetical
|
PARA.
|
STACK,
|
statements
| ||
order.
|
NONE when
| ||||
no type is
| |||||
coded, etc.
| |||||
Symbol table: This table contains the following details:
Name
|
Type column
|
Value column
|
Attribute column
|
Lists the names of
|
L NEAR or L FAR
|
Provides the hex
|
Lists the attributes
|
all defined items, in
|
(Specifies a near or
|
offset from the
|
of a symbol,
|
alphabetical order
|
far label)
|
beginning of a
|
including its
|
N PROC or F
|
segment for names,
|
segment and length.
| |
PROC (Specifies a
|
labels, and
| ||
near or far
|
procedures.
| ||
Procedure)
| |||
BYTE, WORD,
| |||
DWORD, etc.
| |||
(Specify a data
| |||
item) etc.
|
Emu 8086
This is an emulator Programming that can be used for executing/testing/ emulating 8086 programs. The Program was available at website http://www.emu8086.com. This program is priced. The following are some of the salient points of this package:
! It contains a source editor, assembler, dis-assembler, and software emulator for assembly program with debugger, and step-by-step tutorials.
! It is helpful for those who just begin to study assembly language. It compiles the source code and executes it on emulator step by step. This is a very useful feature. You must see the changed values with each step. The emulator has an easy Visual interface, which allows watching registers, flags and memory contents during the program execution. You can also watch stack.
! Arithmetic & Logical Unit (ALU) shows the last operation executed by ALU, especially arithmetic operations like addition. This will enhance your understanding.
! Please note, as the 8086 machine code is fully compatible with all the next generations of Intel's microprocessors, including Pentium II and Pentium 4. This 8086 code is very portable, since it runs both on old and on the modern computer systems. Another advantage of 8086 instruction set is that it is smaller, and thus easier to learn.
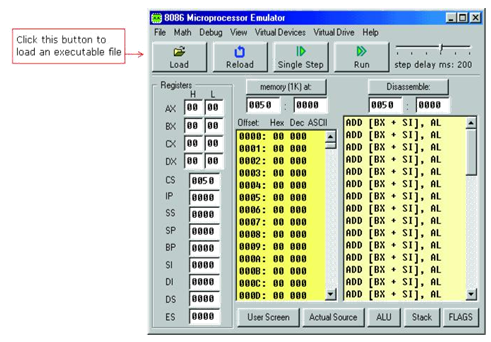
How to start Emu 8086?
1. Start EMU8086 by selecting the ICON from the desktop, or by running Emu8086.exe. The following window appears:

2. For referring to already stored samples you can select sample button.
3. You can use your own programs also stored in suitable .asm files.
4. You can compile or emulate the Program.
5. Click Single Step button and watch how the code is being executed.
Using Emulator
If you want to load your code into the emulator to watch the effect of step by step execution on registers, flags, stach etc you must select the emulate option this is a great learning tool; just click "Emulate" button ![]() . On selecting emulate button you will see the following window.
. On selecting emulate button you will see the following window.
You can press the buttons at the bottom to watch other windows also along with your program. Please notice even memory offset values as shown and effect can be seen over them also.
You can use single step button to execute next instruction. Watch the effect of this single step on Instruction Pointer (IP), and other registers.
If you double click on register text-boxes it will open "Extended Viewer" window with value of that register converted to all possible forms. You can change the value of the register directly in this window.
Double click on memory list item; it will open "Extended Viewer" with WORD value loaded from memory at selected location. Lower byte is at lower address that is: LOW BYTE is loaded from selected position and HIGH BYTE from next memory address.
You can change the value of the memory word directly in the "Extended Viewer" window.
You can change the values of registers on runtime by typing over the existing values shown.
Flags button allows viewing and showing the flags set by the last ALU operations. The ALU button shows the ALU temporary register. The stack button shows the current stack values.
The DEBUG Program
The DOS DEBUG program is a useful tool for writing and debugging assembly programs. This also allows for examining the contents of a file or memory. DEBUG.EXE is
available in DOS in a directory named \DOS or in Windows 95/98 by selecting the MS-DOS prompt from Start Menu. You may run DEBUG in a window. You can also use cut and paste through clipboard.
Starting Debugger : type DEBUG and press <Enter>.
DEBUG starts and a prompt, a hyphen (-), appears on the screen. DEBUG is now ready to accept your commands.
The following simple options exist for starting DEBUG:
1. To create a file or examine memory, type just DEBUG
2. To modify or debug a program (.COM or .EXE) type DEBUG <file name>. The file name should have a suitable path.
Some Tips
! Initially CS, DS, ES, and SS registers have the address of the 256-byte (100H). This initial size is referred to Program Segment Prefix (PSP). The actual user program work area starts after this.
! The flags of Debug appear as:
Flag
|
When ON
|
When OFF
| |||
Name
| |||||
Overflow
|
OV
|
Overflow
|
NV
|
No overflow
| |
Direction
|
DN
|
Descending
|
UP
|
Ascending
| |
down
|
upwards
| ||||
Interrupt
|
EI
|
Interrupts are
|
DI
|
Interrupts are
| |
enabled
|
disabled
| ||||
Sign
|
NG
|
Negative
|
PL
|
Positive
| |
Zero
|
ZR
|
ZERO value
|
NZ
|
Non zero
| |
value
| |||||
Auxiliary
|
AC
|
Auxiliary
|
NA
|
No auxiliary
| |
Carry
|
Carry
|
carry
| |||
Parity
|
PE
|
Even parity
|
PO
|
Odd parity
| |
Carry
|
CY
|
Carry
|
NC
|
No carry
| |
! Memory address is assigned using segment:offset pair. Please note that the data segment for .EXE programs begins at DS:0, whereas that for .COM program begins DS: 100 (same as instruction)
! DEBUG assumes all numbers entered to be hexadecimal, so you need not type trailing H.
! F1 key duplicates the previous command one character at a time.
! F3 duplicates the entire previous command.
! DEBUG commands are not case sensitive.
Some Commands of DEBUG
Let us look into some of the important commands of debug:
Command
|
Meaning
|
Purpose
|
A
|
Assemble
|
Translates assembly source statements into
|
machine code. The operation is especially
| ||
useful for writing and testing small assembly
| ||
programs and for examining small segments of
| ||
code.
| ||
C
|
Compare
|
Compares the contents of two areas of
|
memory. The default register is DS.
| ||
D
|
Display
|
Displays the contents of a portion of memory
|
in hex and ASCII. The default register is DS.
| ||
G
|
Go
|
Executes a machine language program that you
|
are debugging through to a specified
| ||
breakpoint.
| ||
I
|
Input
|
Inputs and displays one byte from a port, coded
|
as I port-address.
| ||
N
|
Name
|
Names a program or a file that you intend to
|
read from or write onto disk. Code the
| ||
command as N filename.
| ||
O
|
Output
|
Sends a byte to a port, coded as O port –
|
address byte.
| ||
Q
|
Quit
|
Exits DEBUG. The operation does not save
|
files; use W for that purpose.
| ||
R
|
Register
|
Displays the contents of registers and the next
|
instruction.
| ||
S
|
Search
|
Searches memory for characters in a list. If the
|
characters are found the operation delivers their
| ||
addresses; otherwise it does not respond. The
| ||
default register is DS.
| ||
T
|
Trace
|
Executes a program in single –step mode. Note
|
that you should normally use P (Proceed) to
| ||
execute through INT instructions. The default
| ||
registers are CS:IP.
| ||
U
|
Unassemble
|
Unassembles machine instructions, that is,
|
converts them into symbolic code. The default
| ||
registers are CS:IP.
| ||
W
|
Write
|
Writes a file from DEBUG. The file should
|
first be named (see N) if it wasn't already
| ||
loaded. The default register is CS.
|
WHAT IS ASSEMBLY PROGRAMMING FILE
You must maintain a file for keeping each Assembly program. The file should contain the following:
1. The overall description or explanation of your program.
2. Write the logical flow of program and algorithm steps.
3. Assembly code listings with comments.
4. Testing of program and different register values.
5. Please note any error encountered /any other experience during the programming
Following is an example which may help you in writing assembly programs:
Problem
Write a program to display "Hello IGNOU!"
Algorithm Steps
1. Start
2. Store 'Hello IGNOU!' in variable named msg
3. Load address of the variable msg to DX register
4. Print using DOS interrupt using function 9 (Recollect function 9 requires 9 to be loaded in register AH followed by a call to Interrupt 21h. )
5. Exit to operating system. Once the message has been printed, it successfully terminates the program by returning to operating system. (Remember this is achieved by moving "4C" to AH register and calling Interrupt 21h)
Program
; DISPLAY Hello IGNOU!
; Standard header:
ORG 100H
; Jump to start:
JMP START
; Data:
msg DB 'Hello, IGNOU!','$'
; Load address of msg to DX register: START: LEA DX, msg
; Print using DOS interrupt:
MOV AH, 9 INT 21h
; Exit to operating system: MOV AH, 4Ch
INT 21h
No comments:
Post a Comment